Big Data Step by Step.Part 3: MapReduce for Network Security
In the previous article we installed Hadoop and configured a cluster on our hardware. Now we are ready to start processing data. As described in Big Data Step by Step. Part 1: Getting Started, Hadoop is not a single piece of software, but rather an ecosystem of many different components. The one component that started it all is the MapReduce framework. In the earliest Hadoop versions it was the only data processing method available on the platform and it has contributed tremendously to the popularity that Hadoop enjoys today. Therefore, MapReduce will be the technology of choice for our first experiment. This experiment is aimed at Big Data Developers and Engineers, but may be useful as background information for Data Scientists. Some Linux experience and Java programming experience is required to reproduce the examples in this article.
Parts in this series:
Big Data Step by Step. Part 1: Getting Started
Big Data Step by Step. Part 2: Setting up the Cluster
Big Data Step by Step. Part 3: Experiments with MapReduce
Big Data Step by Step. Part 4: Experiments with HBase
MapReduce
MapReduce is the first and most well-known processing framework in the Hadoop ecosystem. It allows for distributed processing of large data sets from HDFS, by using Mappers to create Key-Value pairs, sorting these pairs by key and using Reducers to process the bags of sorted Key-Value pairs into an end result.
The often used example of a MapReduce job is the wordcount. The Mapper is used to chop lines from an input text file into separate words and to emit Key-Value pairs, where the word itself is the key and a ‘1’ is the value (indicating 1 occurence of the word). The native MapReduce sorting mechanism ensures that all pairs with the same key end up in the same Reducer. The Reducer then increments a counter for every occurrence of the word, resulting in a list of words with the amount of occurences of that word in the input file.
The power of MapReduce is very fast parallel processing of huge data files. Its weakness is the fact that, even though processing is parallel, file access is very much sequential and batch-oriented. This means that every time the job is executed, it will run through the entire input file. There is no random access to data, which makes MapReduce processing an extremely high latency business.
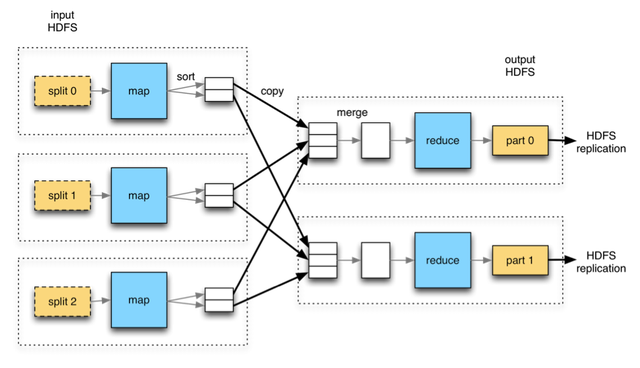 Source: Hadoop – The Definitive Guide, by Tom White
The experiment
The next question is: what we are going to do with it? Preferably something useful of course. One of the tasks that Hadoop is very useful for is analysis of log files. Depending on the verbosity level, log files can grow very fast and very big. A good stream of log output over time can easily qualify as “Big Data”. For example, Hadoop can be used to analyze machine logs to predict failures, find wear patterns or improve maintenance schedules. Though this is a very interesting side of Big Data technology, unfortunately we do not have a factory full of machines at our disposal to experiment with. However, log data does not exclusively come from factory machines. Another good source of log data is network devices. We do happen to have a network router and firewall available. In our case it is a device that runs the pfSense router/firewall software. Devices like this one are easy to build. They require only an old computer (with preferably two network cards) and an installation image of pfSense. A good installation description can be found here.
By default, pfSense only keeps a very short log history. The nice thing is that it can be configured to send its log messages to a remote syslog server. This means that any logging generated by the device can be sent to an IP address to be specified. The receiving side can be a Linux computer with a syslog daemon running. A good description of this is available at the Linux Journal website. This machine captures all logging and writes it to file.
Now that we have log data available, what do we want to do with it? Since we have network firewall output in our log files, it makes sense to use it to report security incidents. Security threats are abundant on the internet. An insight into the attempts made on our internet connection could prove valuable in securing the network. So there we have our first information requirement: reports to show security incidents. Luckily, we have a processing environment and we have the data to meet the need. Let’s get to work!
Analyzing the source data
First, we need to analyze what is actually in our data. pfSense outputs a number of log files, not all of which are of interest to our purpose. It appears that pfSense filterlogs contain output from the firewall rules, which is a likely place to find security related items. Some searching on the pfSense website teaches us that they are formatted by a very well described grammar. Here is an example of a filterlog line:
[code language=”bash”]
2016-04-12T23:59:13+02:00 pfsensemachine.local filterlog: 5,16777216,,1000000103,eth0,match,block,in,4,0×28,,49,57976,0,DF,17,udp,29,41.***.***.69,82.***.***.23,1421,137,9
[/code]
We can get some interesting facts from this line (far from exhaustive):
Date and time of event: 2016-04-12T23:59:13+02:00
Hostname of machine logging the event: pfsensemachine.local
Network interface: eth0
Reason: match (the firewall rule was matched)
Action: block (the connection was blocked)
Direction: in (it was an inbound connection on the interface)
IP version: 4
Protocol: UDP
Source address: 41.***.***.69 (masked for obvious reasons)
Destination address: 82.***.***.23 (masked for obvious reasons)
Destination Port: 137 (NetBIOS, known to be a vulnerable protocol)
Since eth0 is our WAN interface, the log line tells us that an incoming connection from the internet was blocked. Some person or device tried to connect to our network and was denied access. Not all blocked connection attempts are malicious. However, analysis of blocked incoming connections may show patterns that would otherwise remain hidden in log files that nobody bothers to read. This opens the possibility to report on possibly malicious activity. Time to write some MapReduce code!
The job
As shown previously, MapReduce uses Mappers to create bags of Key-Value pairs for processing by Reducers. This means our Mappers need to extract events of interest from log files and emit those in the form of Key-Value pairs, such that our Reducers can summarize these events into reports.
The Mapper:
- Dissects the log line, using the pfSense grammar.
- Processes the line if it contains a blocked incoming connection attempt on the WAN interface. It discards other lines (currently of no interest to us).
- For every useful line, it emits the following Key-Value pairs:
* Key = source IP address. Value = full log line.
* Key = Destination port. Value = full log line.
* Key = hour of the day. Value = full log line.
This enables the Reducer to:
- Summarize blocked connections on:
* Source IP address.
* Destination port.
* Hour of the day.
In this example we keep it simple, but of course we could include many other things. IP address to Geographic mapping to see the country from which the attempt was made, detailed reports on protocols, even something as seemingly useless as the weather in the country of origin at the time of the attempt. Also we could analyze traffic volumes to find unusual activity or to find bottlenecks in the network infrastructure. A lot is possible with the right data available!
Writing the code
For this project we use Eclipse on a development machine. First, create a new Java project in Eclipse:
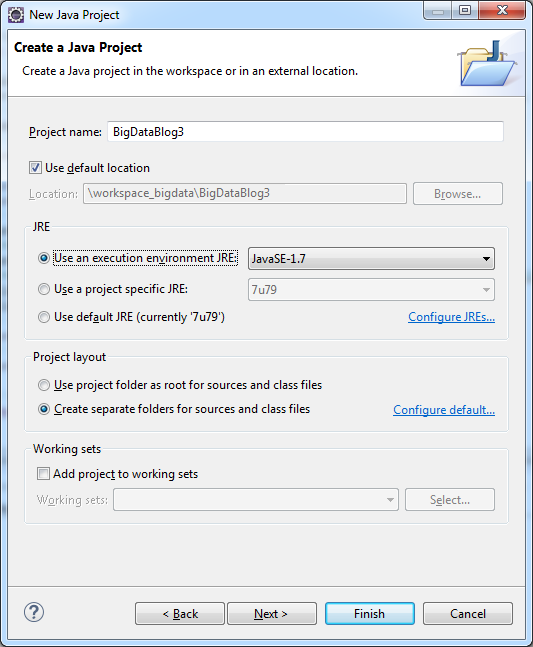
Make sure to set the JRE version similar to the one used in the Hadoop cluster, in our case Java 7.
To create a MapReduce job, we need two .jar library files from our Hadoop installation. They can be found on the servers of your cluster in folders:
- /opt/cloudera/parcels/CDH-5.7.0-1.cdh5.7.0.p0.45/jars/hadoop-common-2.6.0-cdh5.7.0.jar
- /opt/cloudera/parcels/CDH-5.7.0-1.cdh5.7.0.p0.45/jars/hadoop-mapreduce-client-core-2.6.0-cdh5.7.0.jar
The numbering may be different on your installation, depending on your Cloudera version. Use a tool like FileZilla or WinSCP to get the files to your development machine. You can create a “/lib” folder in your project and copy the JAR files there. In project settings, import the files to the project. Right-click on your project, select Properties and go to the Java Build Path:
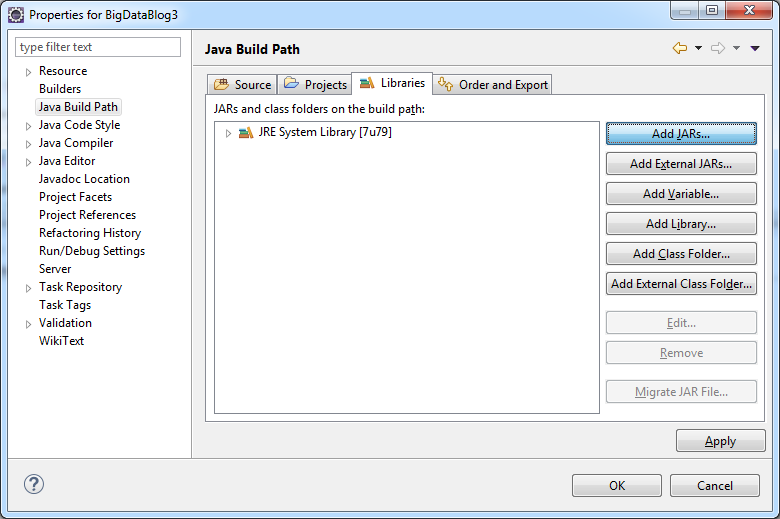
Click Add JARs:
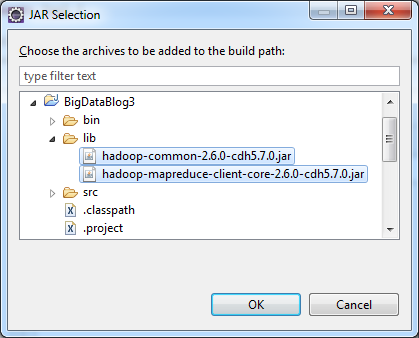
Select both JAR files and click OK. They are now imported into the project, which makes a range of Hadoop MapReduce classes available to use in your code.
Now create a new Java class. Call it LogFileAnalyzerMapper and put the following code in it:
[code language=”java”]
package com.arthurvogels.bigdatablog.mapreducelogfiles;
import java.io.IOException;
import org.apache.hadoop.io.LongWritable;
import org.apache.hadoop.io.Text;
import org.apache.hadoop.mapred.MapReduceBase;
import org.apache.hadoop.mapred.Mapper;
import org.apache.hadoop.mapred.OutputCollector;
import org.apache.hadoop.mapred.Reporter;
public class LogFileAnalyzerMapper extends MapReduceBase implements Mapper<LongWritable, Text, Text, Text>{
@Override
public void map(LongWritable key, Text line, OutputCollector<Text, Text> output, Reporter reporter) throws IOException {
// Input key is the line number
// Input value is the entire line
// Output key either a source IP, a destination port or an hour of day
// Output value is the full log line
String logLine = line.toString();
// The log line is divided by spaces into three parts: the timestamp, the hostname, the logname and the logdata
// Chop the line into three parts
String[] lineParts = logLine.split(" ");
// The third part is the actual logdata string
String logData = lineParts[3];
// Split the logdata by comma delimiter
String[] tokens = logData.split(",", -1);
// Take the items we want to use from the log data
// The network interface is the 5th field
String nic = tokens[4];
// The action is the 7th field
String action = tokens[6];
// The direction is the 8th field
String direction = tokens[7];
// The IP version is the 9th field
String ipVersion = tokens[8];
// We only want to process this line if it fits our criteria. For the sake of simplicity, we take
// only lines where an incoming ipv4 tcp or udp connection on the eth0 interface was blocked
if("ue0".equals(nic) && "block".equals(action) && "in".equals(direction) && "4".equals(ipVersion)){
// For IPv4 the protocol number is the 16th field
String protocolId = tokens[15];
// Check if this is either tcp (IP protocol number 6) or udp (IP protocol number 17)
if("6".equals(protocolId) || "17".equals(protocolId)){
// If this code is executed it means that the log line fits all the criteria
// Let’s collect the last information we need
// For IPv4 TCP or UDP connections, the source IP address is the 19th field
String sourceIp = tokens[18];
// For IPv4 TCP or UDP connections, the destionation port is the 19th field
String destinationPort = tokens[21];
// Hour of day can be taken from timestamp
String timeStamp = lineParts[0];
String hourOfDay = timeStamp.substring(11, 13);
// Now emit three Key-Value pairs:
output.collect(new Text("SOURCEIP-" + sourceIp), line);
output.collect(new Text("DESTINATIONPORT-" + destinationPort), line);
output.collect(new Text("HOUROFDAY-" + hourOfDay), line);
}
}
}
}
[/code]
The mapper selects only the log lines that contain a blocked incoming connection on the eth0 interface, where the IP version is 4 and the IP protocol is either TCP or UDP. For these lines, three Key Value pairs are emitted, in the form of:
Key: SOURCEIP-84.15.13.18 Value:
Key: DESTINATIONPORT-137 Value:
Key: HOUROFDAY-08 Value:
Then create a new Java class named LogFileAnalyzerReducer and put the following code in it:
[code language=”java”]
package com.arthurvogels.bigdatablog.mapreducelogfiles;
import java.io.IOException;
import java.util.Iterator;
import org.apache.hadoop.io.Text;
import org.apache.hadoop.mapred.MapReduceBase;
import org.apache.hadoop.mapred.OutputCollector;
import org.apache.hadoop.mapred.Reducer;
import org.apache.hadoop.mapred.Reporter;
public class LogFileAnalyzerReducer extends MapReduceBase implements Reducer<Text, Text, Text, Text>{
@Override
public void reduce(Text key, Iterator values, OutputCollector<Text, Text> output, Reporter reporter)
throws IOException {
// Initialize a counter
int count = 0;
// Iterate all values for this key
while(values.hasNext()){
values.next();
// Increment the counter
count++;
}
// Construct an output CSV string
String outputValue;
String keyString = key.toString();
// If this is a source IP address
if(keyString.startsWith("SOURCEIP-")){
// Extract the source IP address from the key
String sourceIp = keyString.substring(9);
outputValue = "source IP address," + sourceIp + "," + count;
// Emit the result
output.collect(new Text(""), new Text(outputValue));
}
// If this is a destination port
if(keyString.startsWith("DESTINATIONPORT-")){
// Extract the destination port from the key
String destinationPort = keyString.substring(16);
outputValue = "destination port," + destinationPort + "," + count;
// Emit the result
output.collect(new Text(""), new Text(outputValue));
}
// If this is an hour of day
if(keyString.startsWith("HOUROFDAY-")){
// Extract hour of day from the key
String hourOfDay = keyString.substring(10);
outputValue = "hour of day," + hourOfDay + "," + count;
// Emit the result
output.collect(new Text(""), new Text(outputValue));
}
}
}
[/code]
This Reducer simply counts how many values exist for the current key. This is enough for simple reports. If we want to do more advanced things inside the Reducer, we have the full log line available to work with. The output of the Reducer consists of a CSV file that looks like this example:
source IP address,84.***.***.18,257
source IP address,153.***.***.7,46
hour of day,8,3299
Indicating 257 blocked incoming connection from IP address 84.***.***.18 and 3299 blocked incoming connection between 8 and 9 in the morning etc.
Finally, create the class with the main method, in MapReduce terms the “Driver”. Put the following code in it:
[code language=”java”]
package com.arthurvogels.bigdatablog.mapreducelogfiles;
import java.io.IOException;
import org.apache.hadoop.conf.Configuration;
import org.apache.hadoop.fs.Path;
import org.apache.hadoop.io.Text;
import org.apache.hadoop.mapred.FileInputFormat;
import org.apache.hadoop.mapred.FileOutputFormat;
import org.apache.hadoop.mapred.JobClient;
import org.apache.hadoop.mapred.JobConf;
import org.apache.hadoop.util.Tool;
import org.apache.hadoop.util.ToolRunner;
public class LogFileAnalyzerDriver implements Tool {
// The job configuration object
JobConf conf;
/**
* This is the main method to execute
*
* @param args The command line parameters
*/
public static void main(String[] args) {
int result;
try {
// Let the ToolRunner execute this job
result = ToolRunner.run(new Configuration(), new LogFileAnalyzerDriver(), args);
} catch (Exception e) {
// Something went wrong. Result is error code -1
result = -1;
// Show a stacktrace to help debugging
e.printStackTrace();
}
System.exit(result);
}
@Override
public int run(String[] args) throws Exception {
// Create configuration
conf = new JobConf(LogFileAnalyzerDriver.class);
// Set job name
conf.setJobName("pfSense filterlog processor");
// Set output data types (both key and value are text)
conf.setOutputKeyClass(Text.class);
conf.setOutputValueClass(Text.class);
// Set HDFS IO dirs, taken from command line arguments
Path in = new Path(args[1]);
Path out = new Path(args[2]);
// Add IO paths to the configuration
FileInputFormat.addInputPath(conf, in);
FileOutputFormat.setOutputPath(conf, out);
// Set the mapper class for this job
conf.setMapperClass(LogFileAnalyzerMapper.class);
// Set the reducer class for this job
conf.setReducerClass(LogFileAnalyzerReducer.class);
// Run the job
try {
JobClient.runJob(conf);
// Execution finished without exceptions. Result is error code 0 (success).
return 0;
} catch (IOException e) {
// Something went wrong. Show a stacktrace to help debugging.
e.printStackTrace();
// Result is error code -1.
return -1;
}
}
@Override
public Configuration getConf() {
return null;
}
@Override
public void setConf(Configuration arg0) {
}
}
[/code]
Now we have all the code of the Mapper, Reducer and Driver ready, create a run configuration by right-clicking on the Driver class and choosing Run as Java Application:
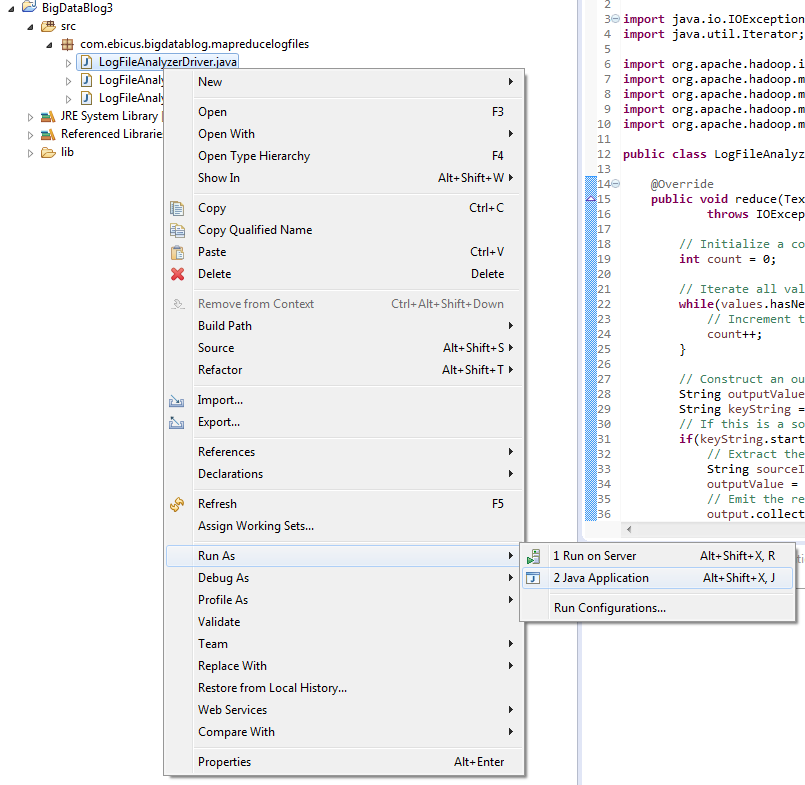
Running the application will fail, since we are not on the Hadoop cluster, but it will create a run configuration for our application. We need this for the next step.
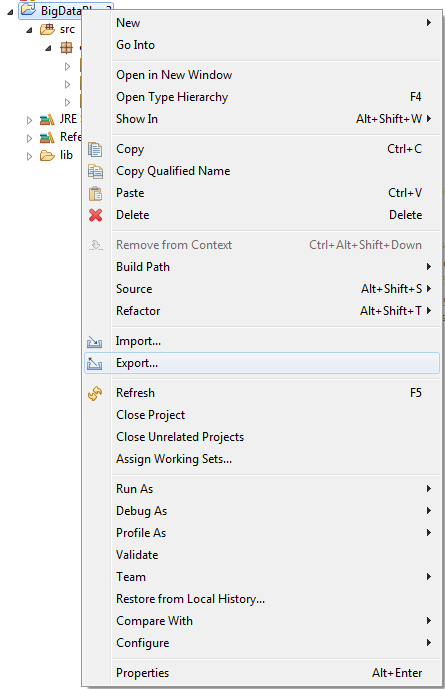
Now we compile our project into an executable JAR file. Right-click on the project and choose export:
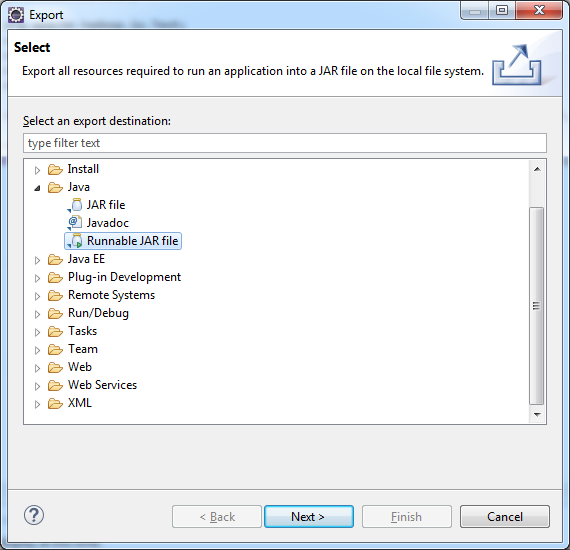
Make it an runnable JAR file:
Choose the right run configuration and choose to copy required libraries into a separate folder. The code will be running on a machine that already contains the right libraries, so we do not need them packed inside the JAR file:
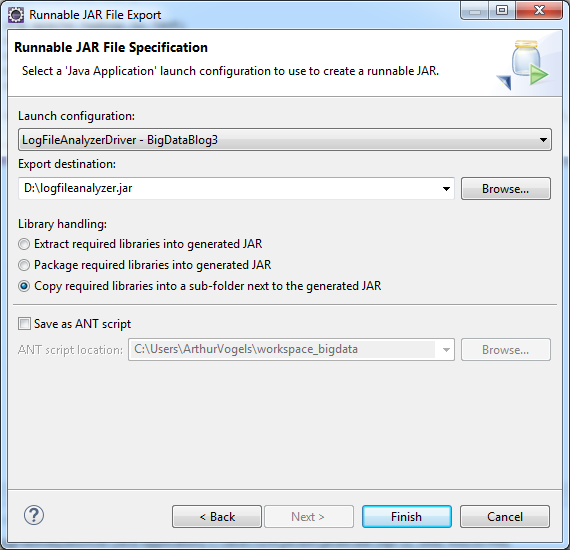
Press Finish.
Hue and uploading source data
Before we can run the job, the source data log file needs to be available in HDFS. We can upload files in Hue. Open the following URL in your webbrowser:
http://cloudera-000.bigdata.local:8888/
The first time login of Hue will show:
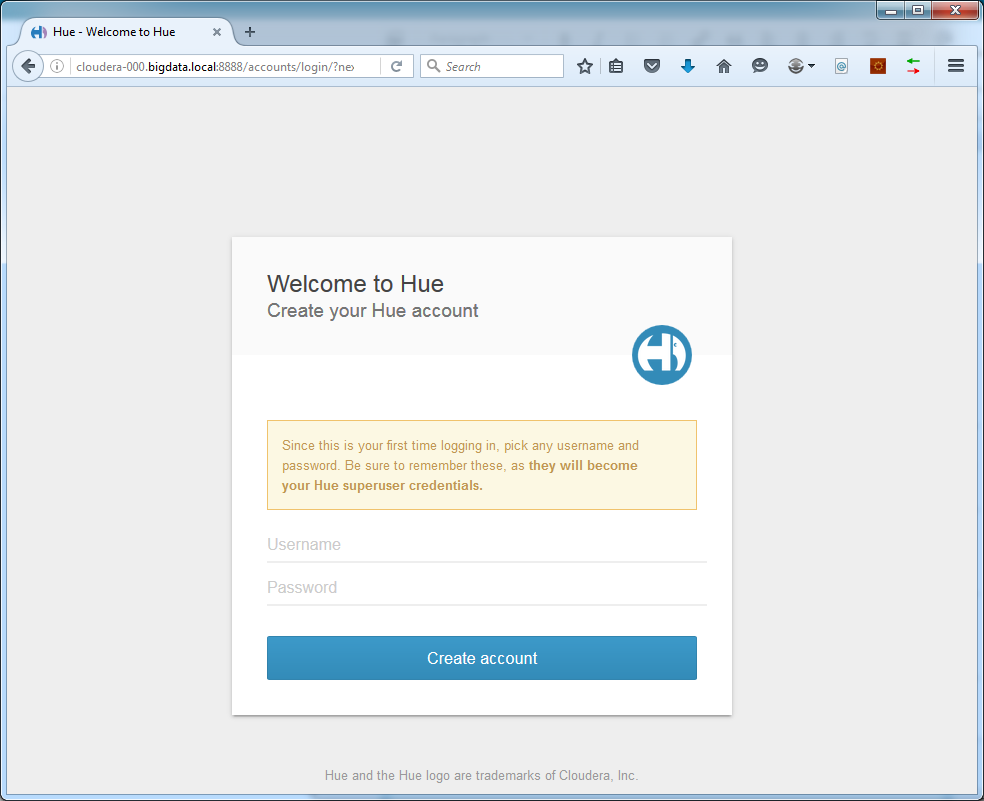
The credentials entered here will be your Hue adminuser, so remember them well.
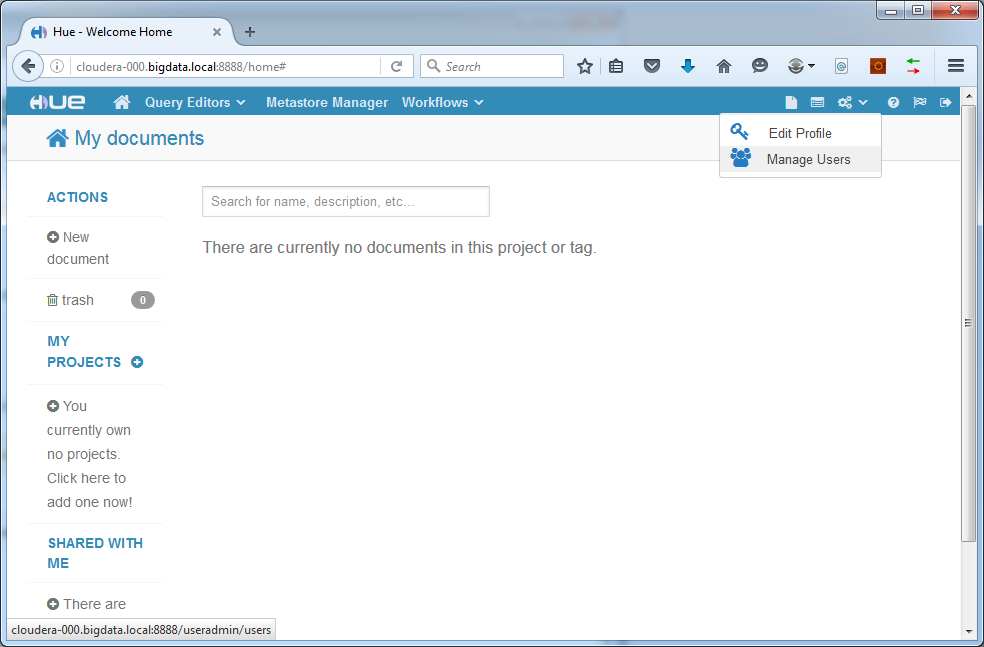
After login some configuration checks will take place. Afterwards, create a new user by clicking the “manage users” icon in the top right corner:
We create the user “weblog”. Of course you can name it differently if you like:
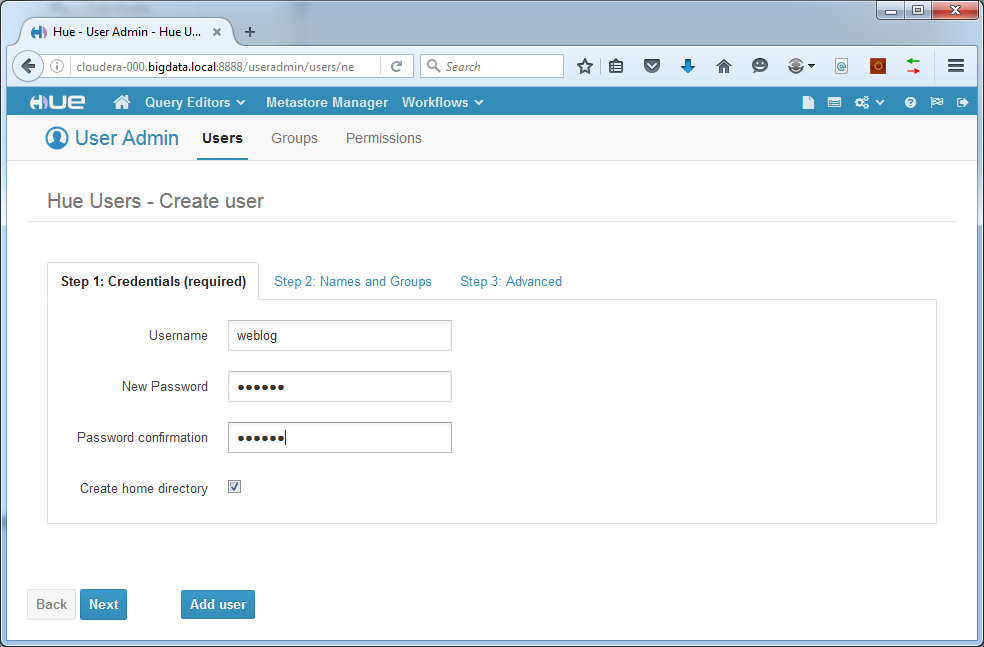
Add the user. Now log out and log back in with your new user.
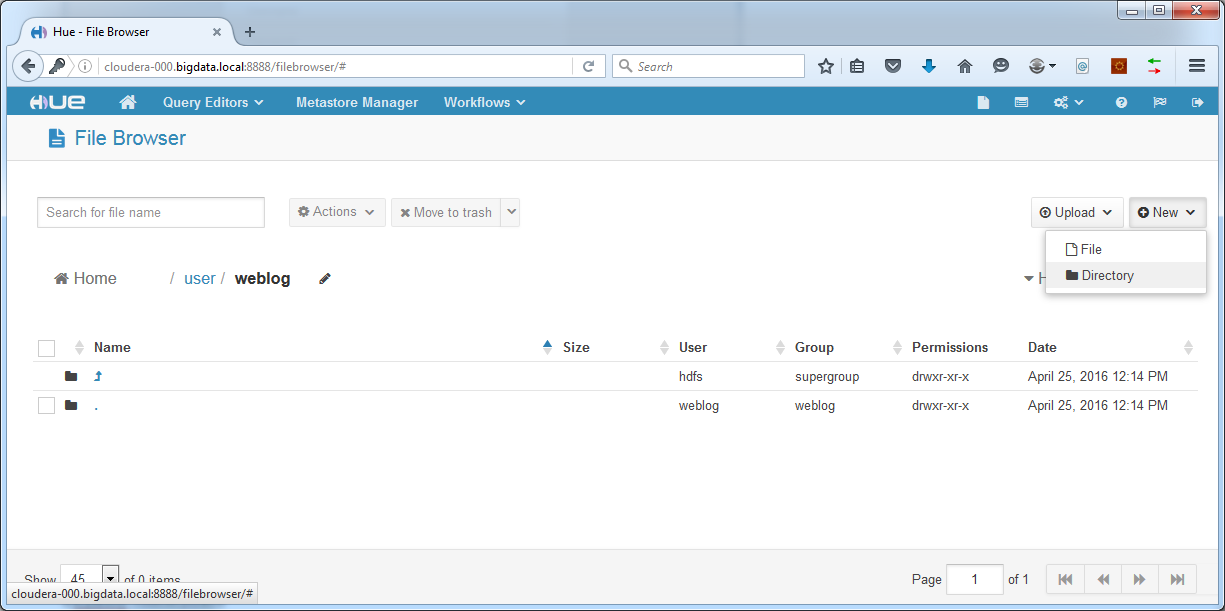
Click the “Manage HDFS” button:
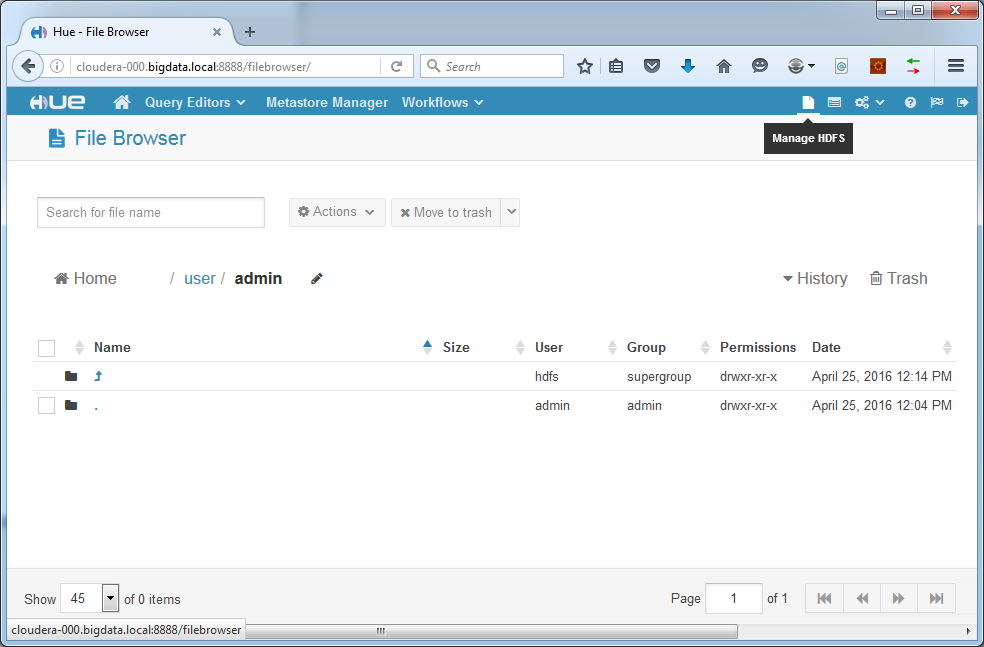
Create a new directory to put the source data logfiles into:
Now upload the logfiles to our new directory. In our example we use logging of an entire month:
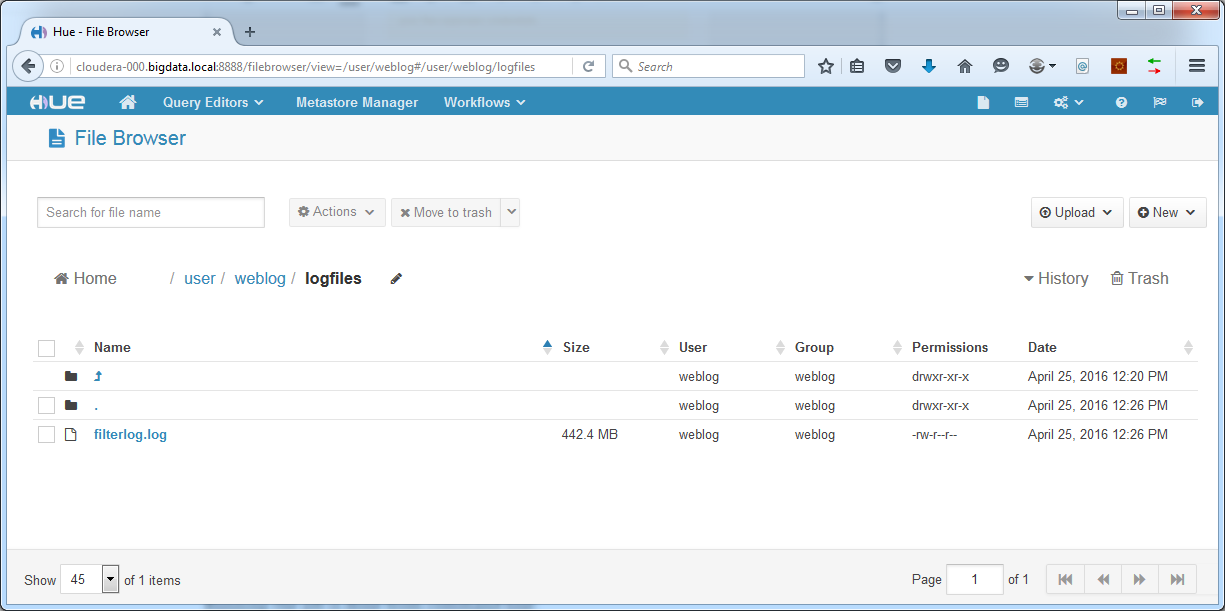
With source data in place, we are ready to run the job.
Running the job
To run the job, we need to copy our logfileanalyzer.jar to the cloudera-000 machine. First, log on to cloudera-000 as root and create a new user and set its password:
[code language=”bash”]
adduser weblog
passwd weblog
[/code]
Next, log in as this new user in FileZilla or WinSCP or another tool to copy logfileanalyzer.jar to /home/weblog (change path according to username).
Running the job is done from command line:
[code language=”bash”]
hadoop jar
[/code]
In our case the arguments are input path and output path. These are paths in HDFS where our source log files are situated and where we want output to be written. For example:
[code language=”bash”]
hadoop jar logfileanalyzer.jar LogFileAnalyzerDriver /user/weblog/logfiles /user/weblog/output
[/code]
This command starts our MapReduce code, reads logfiles from /user/weblog/logfiles and writes output to /user/weblog/output. Running the command looks like this:
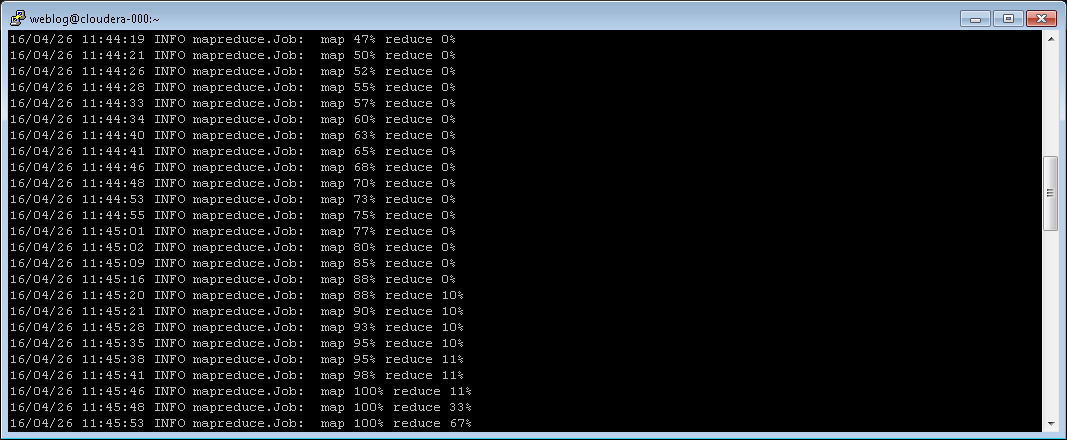
After job completion, a summary is shown:
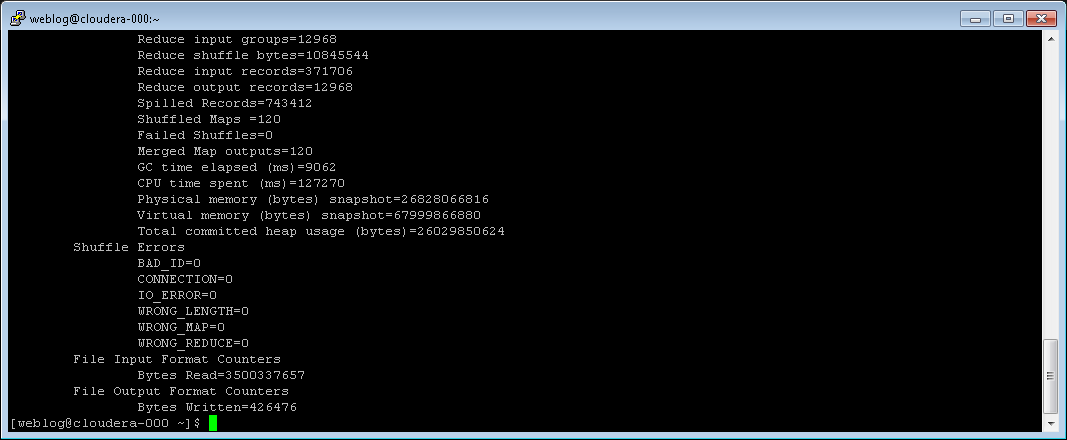
In HDFS a new set of files has become available in the folder we specified as output directory:
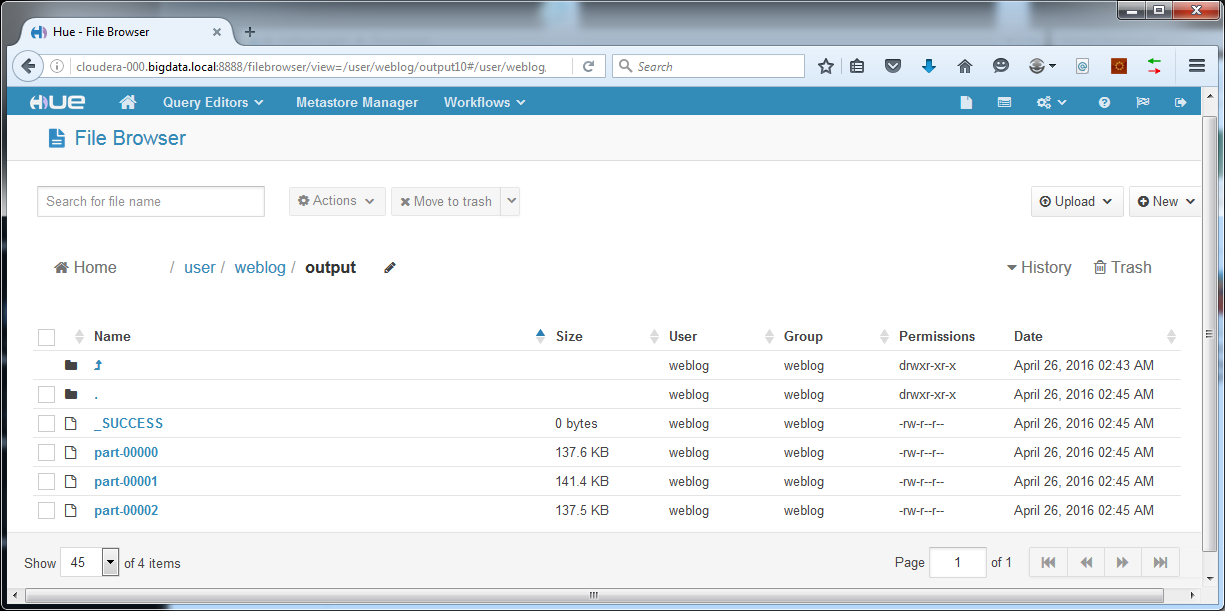
These files can be downloaded from Hue to your computer. Rename them to .csv files.
Results
In a later post more exciting visualization techniques will be demonstrated, but for now we create our reports in good old Excel. Let’s reward ourselves for the hard work with some pretty graphs:
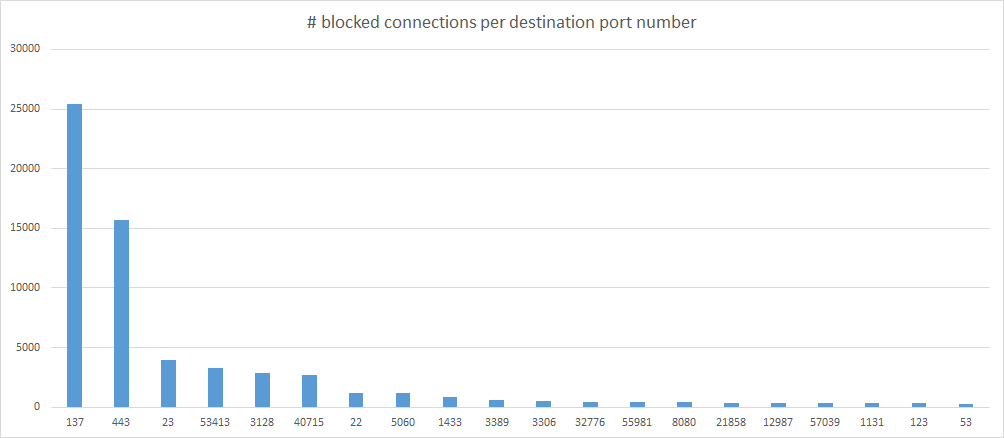
Here we have the number of blocked connections per destination port over a full month. Immediately we see that port 137 is a very popular target. This port is used for NetBIOS file sharing, which should never be open to the internet. Our firewall blocks it with good reason. The fact that it shows up as the most popular target makes you wonder why. Maybe it is still left open by so many devices on the internet that it is an interesting target for “explorers” to try first. No wonder so many ISPs block this port by default. Furthermore, we see the usual suspects showing up. Port 443 (HTTPS), 23 (Telnet), 22 (SSH), 3306 (MySQL), 8080 (HTTP web console on many routers), 123 (NTP), 53 (DNS).
Next is the number of blocked connections per source IP address over the full month:
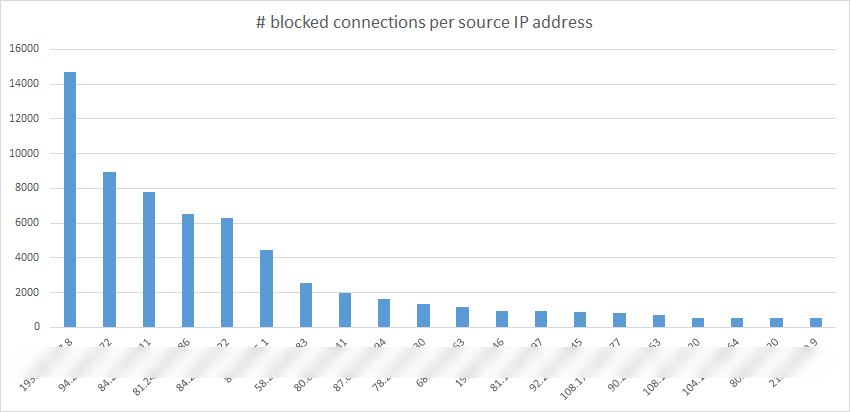
For obvious reasons the actual IP addresses were blurred. We have no proof of bad intentions, so public shaming is out of the question. Of course the huge amount of blocked attempts from only a small number of addresses asks for an investigation. We could change the code of our MapReduce program to see what exactly these IP addresses were trying to connect to and when. With this information in hand we could perform a whois on the top ranking IP addresses (here for example), to find more information on the owners of the addresses.
The distribution of blocked connections over the hours of the day is also an interesting graph:
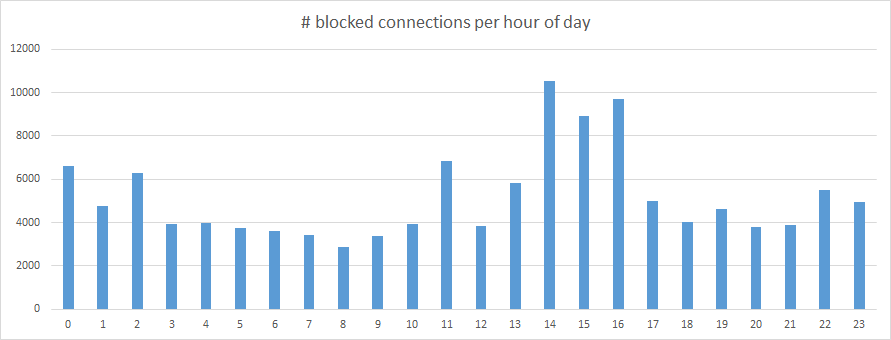
What is the peak in the afternoon? Is this when scriptkiddies come home from school? Food for thought!
Final thoughts
This article has shown the basics of MapReduce and an example of how it can be used to obtain insight in network traffic. The code from this article is executed in batch, which makes it perfect for regular reporting, but less suitable for quick response scenarios. In a later post we will discuss things like random access to log data, real time ingestion and processing of streaming data.
For now, enjoy your first network security reports in MapReduce!
Next time: HBase. Stay tuned!
[ps2id id=’commentaren’ target=”/]
Big Data: is het een hype? Is het een modewoord? Of is het inderdaad de zegen die sommigen erin zien? Wat ons betreft dat laatste natuurlijk. Zeker in een wereld waar klantbeleving steeds belangrijker wordt.
Stay updated
Wij willen je graag op de hoogte houden van het nieuws rondom onze diensten die jou interesseren. Het enige wat je daar voor dient achter te laten zijn jouw mailadres en je voornaam. Vanaf dat moment zullen we je van tijd tot tijd een Ebicus update sturen.